Customer Reporting and Dashboards
Customer Dashboard
When a Customer logs into the ACDC Portal they are immediately taken to the ACDC Welcome homepage. Should the user wish to view the Customer Dashboard, this can be accessed by navigating to: Administration > Customer Dashboard.
The Dashboard helps Customers make more informed decisions by enabling them to gather, analyse, and view reports on their most important and business-driven data.
The Dashboard provides pre-configured defined metrics, statistics, insights and visualisation into current Developer information. It allows the Customer to view live results based on developers, and internal submissions if configured. Customer Administrators can also filter out data pertaining to projects on either Previous Project Validations or Project Activity for a given period of time. By clicking on a listed Project Awaiting Validation, the user will be redirected to the Manage Projects page.
The Dashboard provides pre-configured defined metrics, statistics, insights and visualisation into current Developer information. It allows the Customer to view live results based on developers, and internal submissions if configured. Customer Administrators can also filter out data pertaining to projects on either Previous Project Validations or Project Activity for a given period of time. By clicking on a listed Project Awaiting Validation, the user will be redirected to the Manage Projects page.
- My Developer
- Jobs
- Submissions
- Previous Project Validations
- Projects Awaiting Validation
- Project Activity
My Developers
My Developers is a overview of all Developers assigned to the Customer. This is a quick overview of the total number of Jobs validated in the last week and Submissions per Customer. Jobs refer to the Projects Awaiting Validation and the Submissions refer to the Projects assigned per Developer.
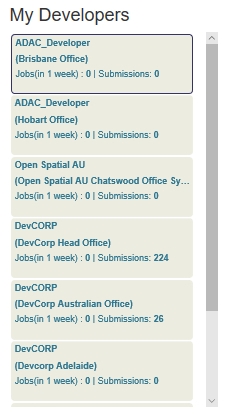
Fig: Customer administrator’s "My Developers" dashboard view.
Previous Project Validations
Previous Project Validations is an overview of previous project validations per developer. This shows the total number of validations broken down into a ‘0 - 4 weeks’, ‘4 - 12 weeks’ and ‘>(Greater Than)12 weeks’ cycles per developer.
To view previous project submissions per developer:
- Select the Developer from the My Developers list.
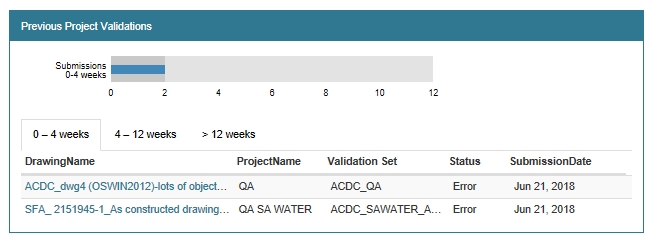
Fig: Customer administrator’s "Previous Project Submissions" dashboard view. - Select the Drawing Name to be viewed.
You will be automatically taken to the Validations page where a list of all validations is displayed - By clicking on one of the file names, the Validation selection is expanded to display the Result Summary detailing the validation results, and if the validation passed or failed.
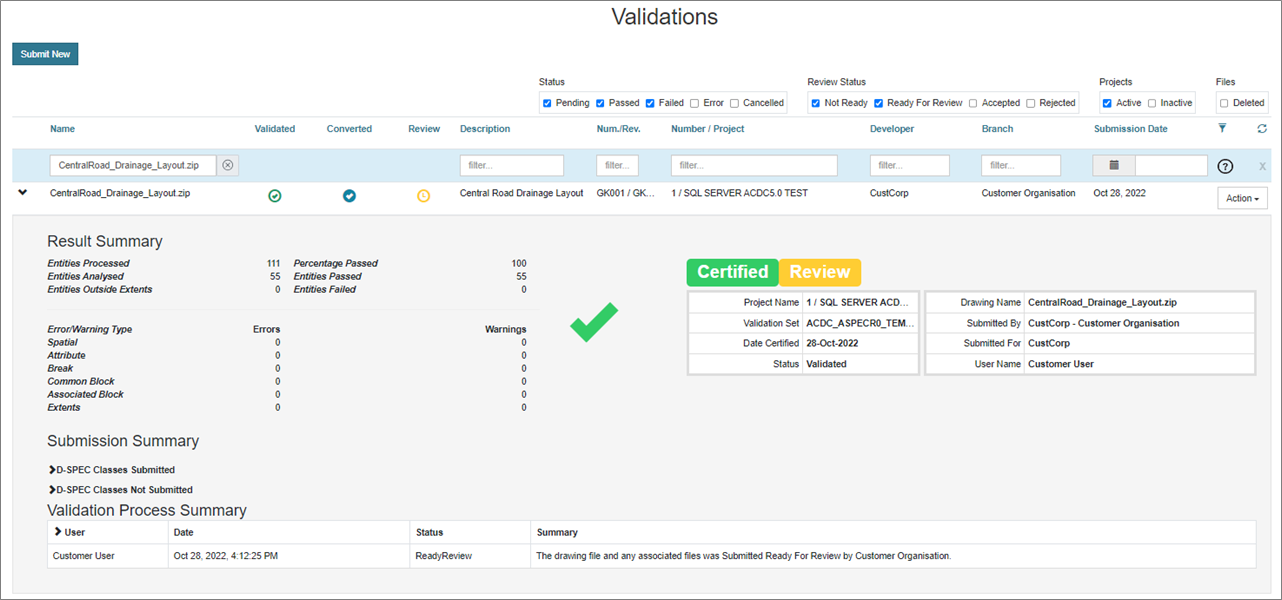
Fig: Customer administrator’s Validations view.
Filtering and Sorting is also available within this interface, to allow for ease of convenience when there are many validations present. By clicking on the Filter icon, there will be a help icon and tool-tip indicating how to use this functionality. The user can then filter data based on a user-defined criteria. Sorting is also available by clicking on given column heading which will re-arrange the data.
Projects awaiting Validation
Projects awaiting Validation is an overview of submitted projects awaiting validation per developer.
To view projects awaiting validation per developer:
- Navigate to Administration > Customer Dashboard.
- Select a Developer from the My Developers list.
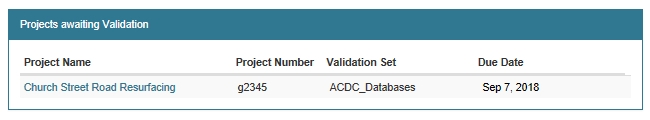
Fig: Customer's administrator "Projects awaiting Validation" dashboard view. -
Select the Project Name to be viewed. The Manage Projects page will be displayed.
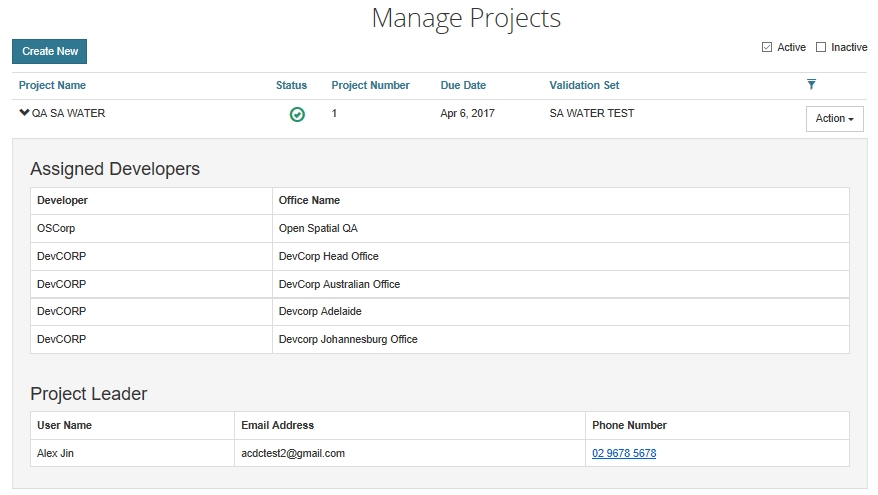
Fig: Customer's administrator Manage Projects view.
Projects Activity
Project Activity is a quick overview of project activity broken down into a 0 - 4 weeks, 4 - 12 weeks and >(Greater Than) 12 weeks cycles per developer.
To view projects activity per developer:
- Select the Developer from My Developers list
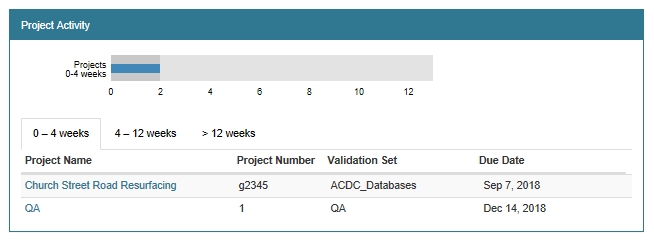
Fig: Customer's administrator "Project Activity" dashboard view - Select the Project Name to be viewed. The Manage Projects page will be displayed.
Fig: Customer's administrator "Manage Projects" view.
Customer's Statistics, Reports and Projects
A customer administrator has access to the reports listed below.
To view Statistics, Reports and Project reports:
- Select the Administration tab.
- Select Reports.
- Select any of the Statistics, Reports or Project reports.
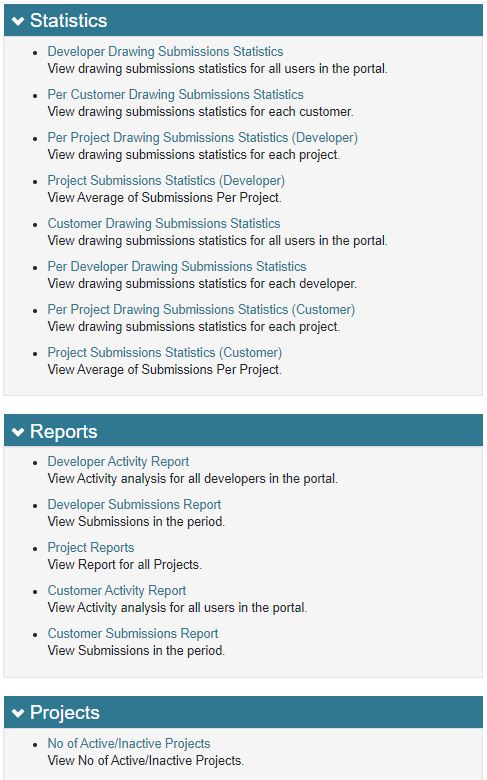
Fig: Statistics, Reports or Project reports.
Statistical Reports
There are 8 different statistical reports available to the Customer Administrator under the Statistics section, namely:
- Developer Drawing Submissions Statistics
- Per Customer Drawing Submissions Statistics
- Per Project Drawing Submissions Statistics (Developer)
- Project Submissions Statistics (Developer)
- Customer Drawing Submissions Statistics
- Per Developer Drawing Submissions Statistics
- Per Project Drawing Submissions Statistics (Customer)
- Project Submissions Statistics (Customer)
Developer Drawing Submissions Statistics
The option Developer Drawing Submissions Statistics provides a view of all the drawing submissions statistics for all developers submitted to the customer organisation in the portal.
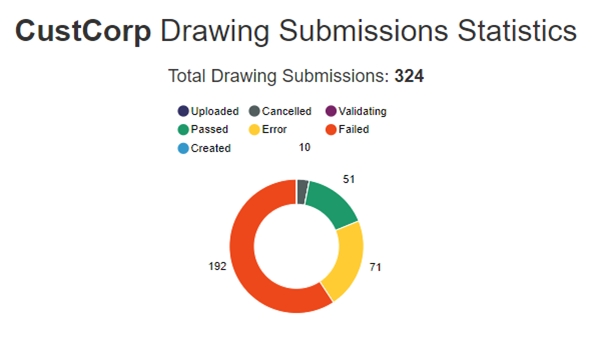
Fig: Developer Drawing Submission Statistics Summary.
Per Customer Drawing Submissions Statistics
The option Per Customer Drawing Submissions Statistics provides a view of overall drawing submissions statistics per customer selected.
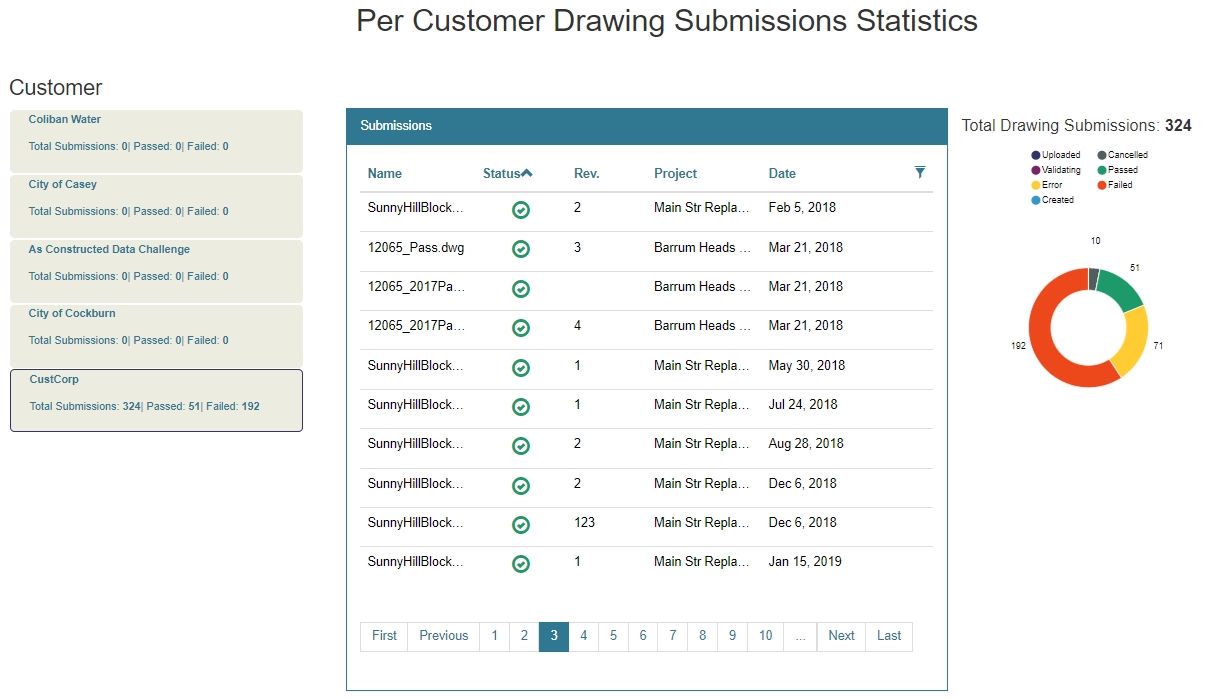
Fig: Drawing Submission Statistics for Your organisation (Customer).
Per Project Drawing Submissions Statistics (Developer)
The option Project Submissions Statistics (Developer) provides a view of the number of submissions per Project selected.
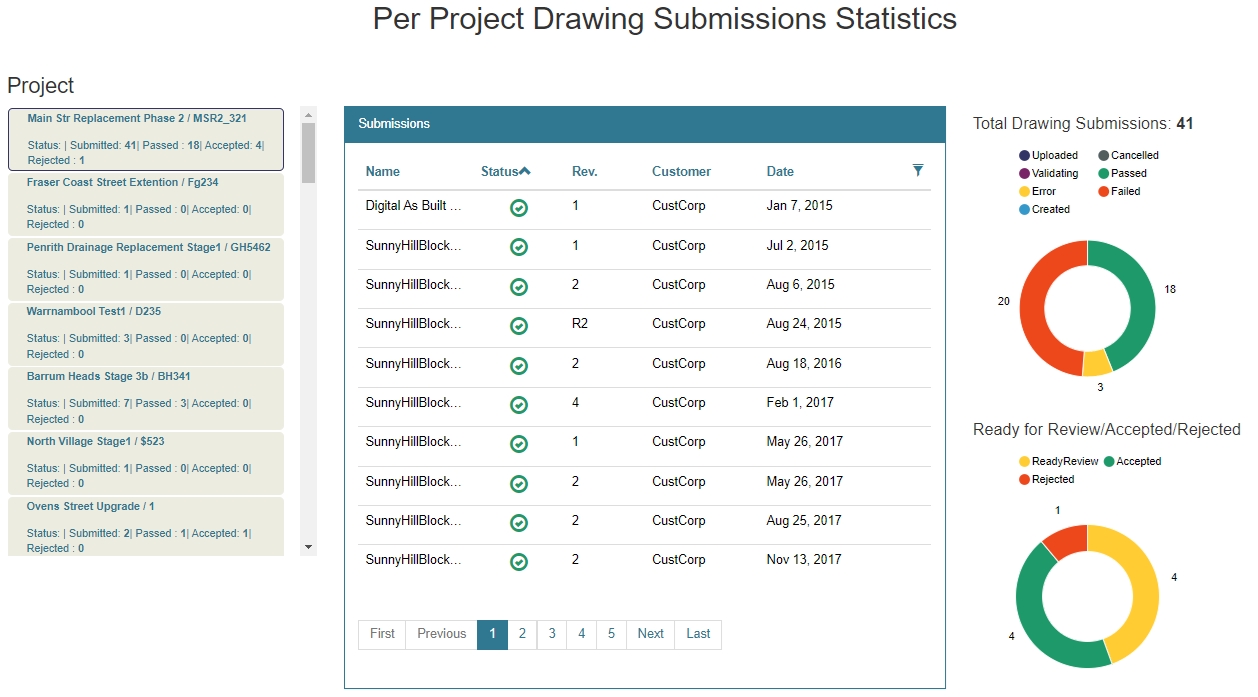
Fig: Drawing Submission Statistics for Your organisation (Customer).
Projects Submissions Statistics (Developer)
The option Project Submissions Statistics (Developer) provides a view of the average number of submissions per Project selected.
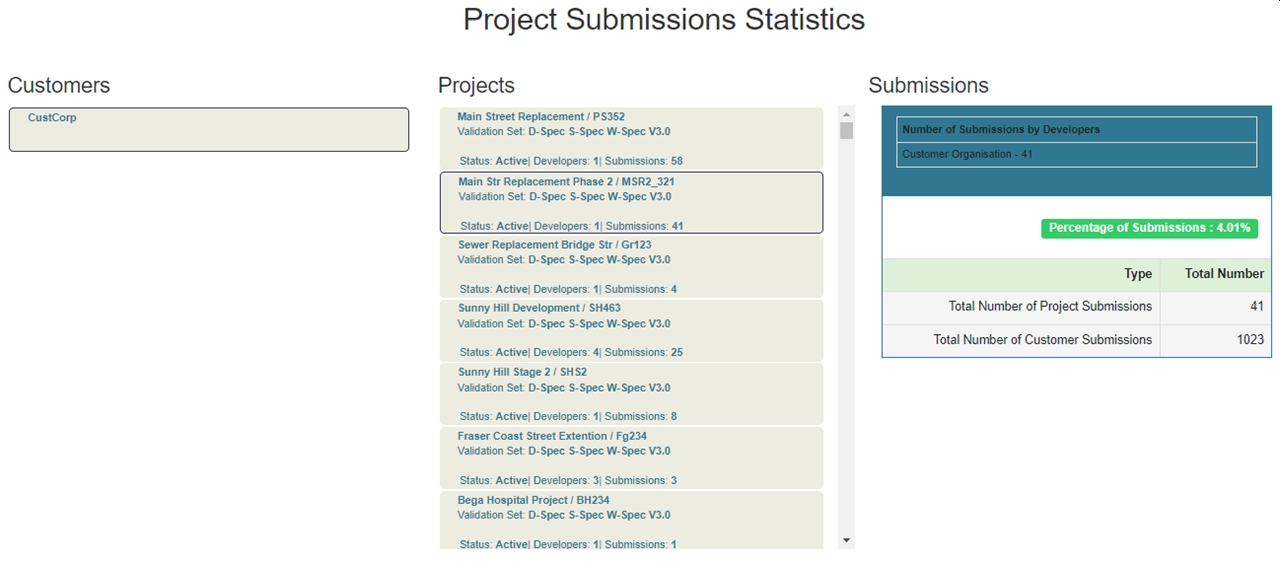
Fig: Drawing Submission Statistics for Your organisation (Customer).
Customer Drawing Submissions Statistics
The option Customer Drawing Submissions Statistics provides a view of all drawing submissions statistics for all users in the portal per Customer.
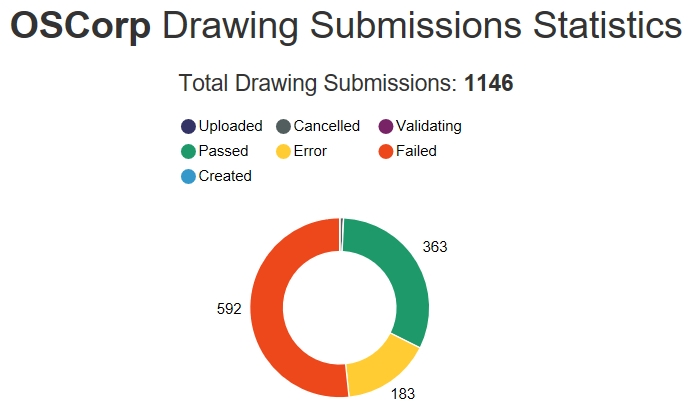
Fig: All Drawing Submission Statistics by customer.
Per Developer Drawing Submission Statistics
The option Per Developer Drawing Submissions Statistics provides a view of drawing submissions statistics for each project per Developer selected.
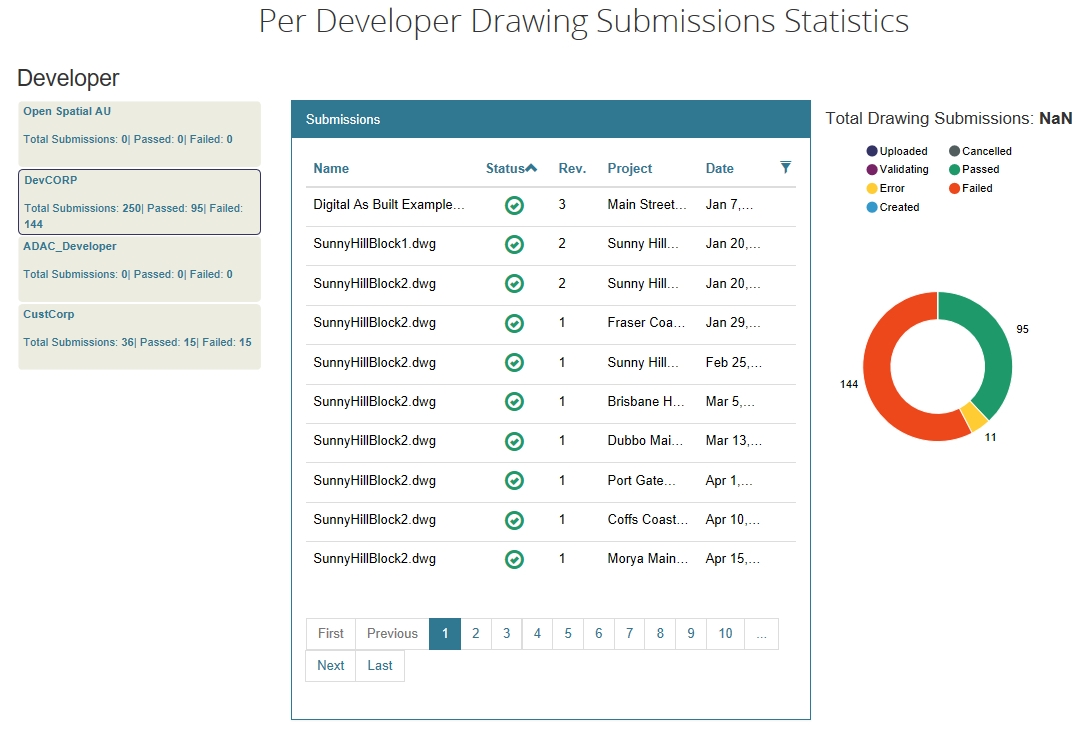
Fig: All Drawing Submission Statistics by developer.
Per Project Drawing Submissions Statistics (Customer)
The option Per Project Drawing Submissions Statistics (Customer) provides a view of drawing submissions statistics for each project selected.
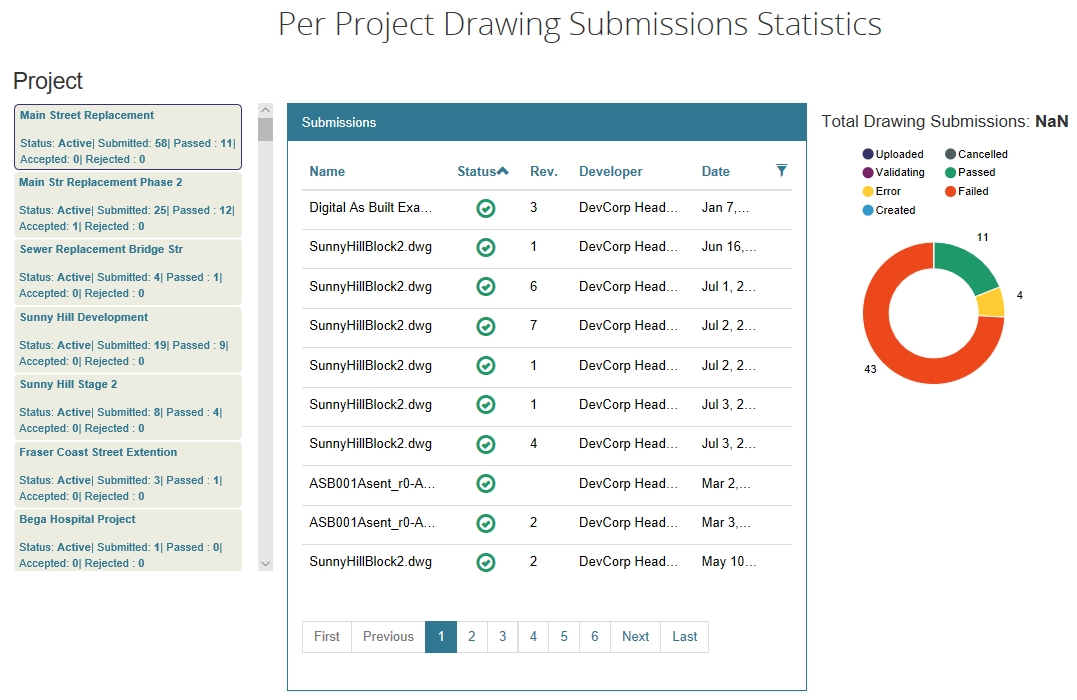
Fig: All Drawing Submission Statistics for each project.
Project Submissions Statistics (Customer)
The option Project Submissions Statistics (Customer) provides a view of the number of submissions as a percentage of the total number of Customer submissions per project selected.
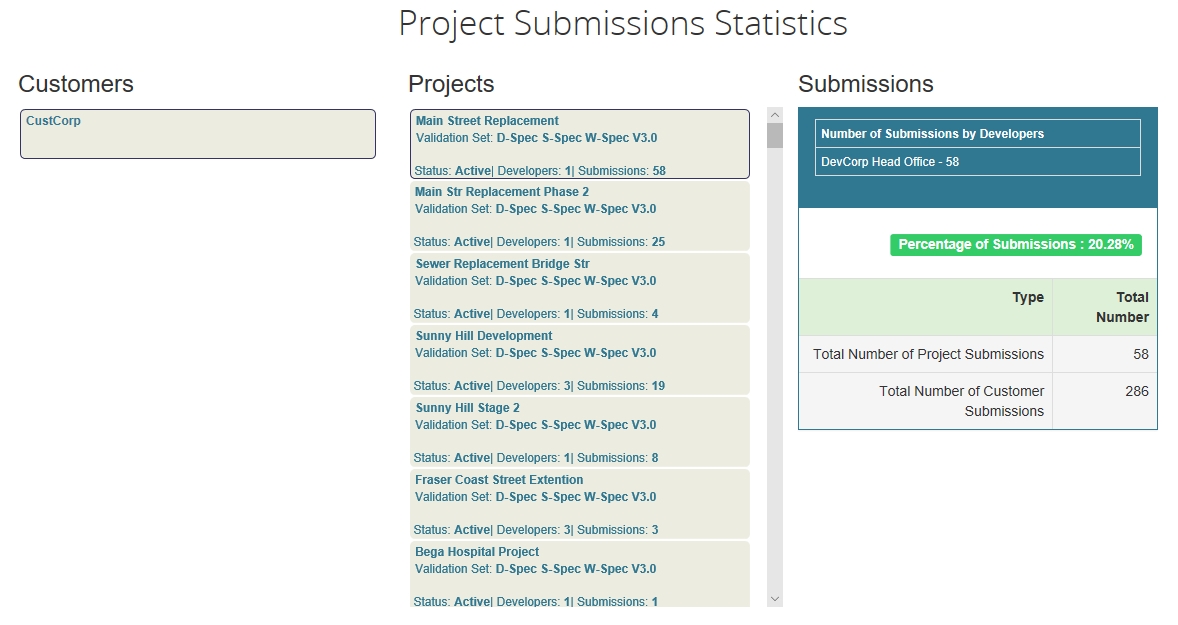
Fig: Average Submission Statistics for each project.
Reports
There are 5 different Reports available to the Customer Administrator under the Reports section, namely:
- Developer Activity Report
- Developer Submissions Report
- Project Reports
- Customer Activity Report
- Customer Submissions Report
The Reports use a date picker to determine the date range required, and by default, when the reports are initially selected from the Reports list, the resultant list returns the last 30 days worth of information. The list can be further refined by selecting specific start and end date ranges using the date picker.
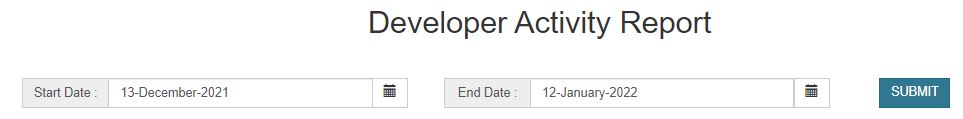
Fig: Report Start and End date picker.
The resultant Report list is returned in date order, where the most recent information is displayed as the first record in the list. The results list can be re-ordered by double clicking on any of the Header names.
The results may also be filtered based on any of the entries in the resultant list. To activate the filter grid, select the Filter button on the far right hand side of the column headers.

Fig: Report Filters on column headers.
The resultant Report list may also be downloaded to a CSV file by selecting the Download CSV button at the bottom of the report list. the CSV filename will match the name of the report selected for download, for example: developer_activity_log.csv.
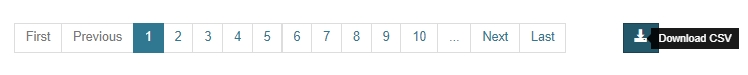
Fig: Report resultant list can be downloaded as a CSV file.
Developer Activity Report
The Developer Activity Report displays a list of activity that has transpired on the Customer’s ACDC Portal by Developer’s Users for the past 30 days. The list can be further refined by selecting specific start and end date ranges using the date picker.
The report provides the Full Name of the Developer User, their email address, the Activity date and time, the Activity Type and a Summary which briefly describes the activity logged.
The most frequent Activity types include the following:
- DrawingSubmission - The Summary column details the drawing name submitted.
- ManageDocument - The Summary column details the name of the documents uploaded or downloaded.
- ManageOffice - The Summary column details the names of the offices added or deleted.
- ManageOrganisation - The Summary column details information pertaining to documents sets added or deleted, privileges added or removed, user groups added or deleted etc.
- ManageProject - The Summary column details information pertaining to projects added, updated or deleted, privileges added or removed for developer offices, etc.
- ManageUser - The Summary column details information pertaining to project documents added or deleted, content types assigned, etc.
- ResetPassword - The Summary column details which user’s passwords were reset.
- SignIn - The Summary column details when each registered user logged onto the Customer’s ACDC Portal.
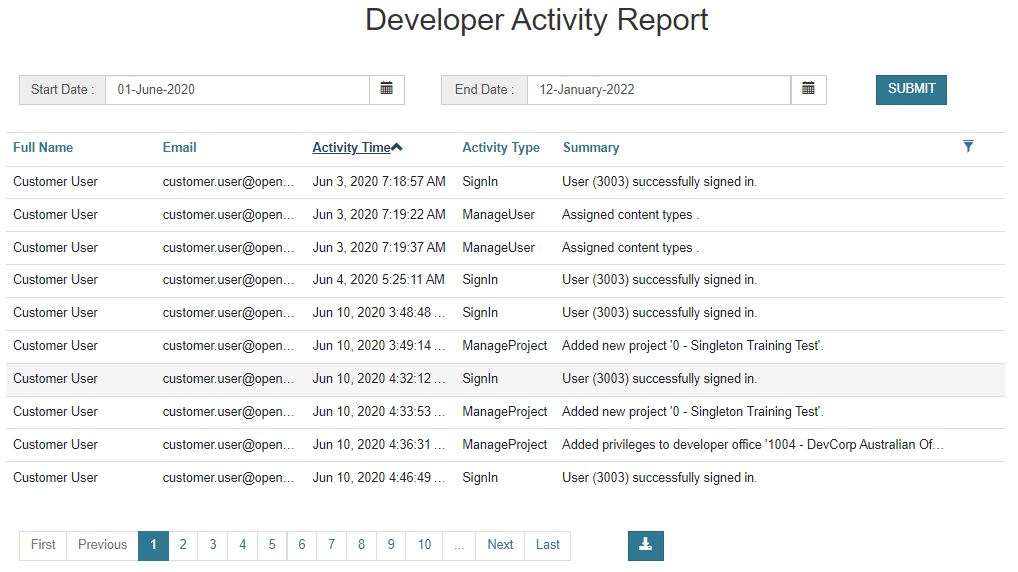
Fig: Developer Activity Report.
Developer Submissions Report
The Developer Submissions Report displays a list of Submissions that have been uploaded for Validation on the Customer’s ACDC Portal by their Developer’s users for the past 30 days. The list can be further refined by selecting specific start and end date ranges using the date picker.
The report provides the following information:
- Customer - Displays the Customer Name.
- Review Status - Displays the review status as an icon as per the descriptions below:
- Review Status not set.
 Review Status of Ready for Review.
 Review Status of Accepted.
 Review Status of Rejected.
- User Name - Displays the name of the user who uploaded the submission for validation.
- Name - Displays the file name added to the validation submission.
- Status - The current status of the Submission depicted by the status icon as per the descriptions below:
- Submission Status not set.
 Submission Status of Passed.
 Submission Status of Error.
 Submission Status of Failed.
 Submission Status of Canceled.
- Id - The unique Submission ID number recorded for each submission in the database.
- Description - Displays the name assigned to the Validation Description when submitted.
- Num. - The Submission Number assigned when the validation was submitted.
- Rev. - The Submission Revision Number assigned when the validation was submitted.
- Project - The name of the Project selected when the validation was submitted.
- Submission Date - The date and time of the validation submission.
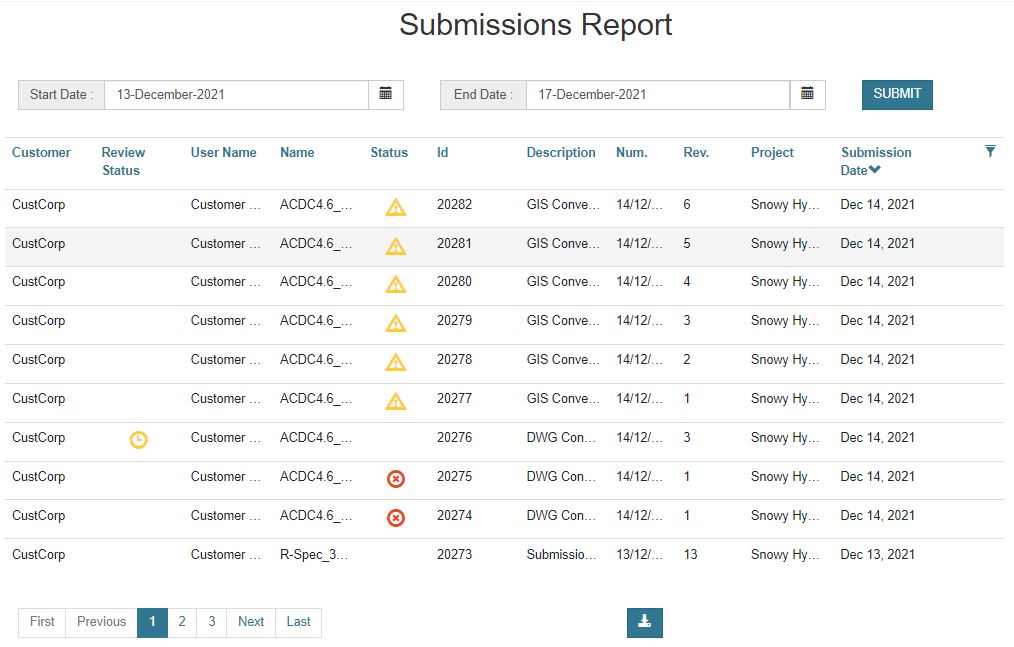
Fig: Developer Submissions Report.
Project Reports
The Project Reports permits the user to extract project information, download as a CSV file for Active Projects only. The resultant list includes information pertaining to validation submissions against the customer projects, the submitted drawing names, who made the submission and on what date.
The user can filter the initial Project Report results by filtering on either the Submission Date, the Project Creation Date or Project Due Date where the user selects the Start and End Dates using the date picker. The results are grouped by the Last Submission and reports on the last unique Drawing or GIS file submitted to the Portal.
The report Description describes the Project Report content based on the Filter By option selected. The different available Filters are as follows:
- Filter By: Submission Date - Description: Filter Projects by Submission Date and reports on the last unique Drawing or GIS file submitted to the Portal.
- Filter By: Project Creation Date - Description: Filter Projects by Creation Date and report on the last unique Drawing or GIS file submitted to the Portal.
- Filter By: Project Due Date - Description: Filter Projects by Due Date and report on the last unique Drawing or GIS file submitted to the Portal.
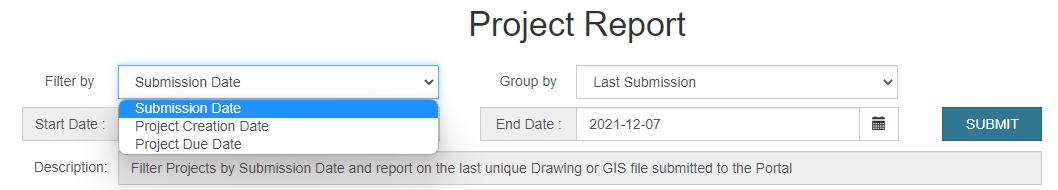
Fig: Project Report Filter by options
The resultant report's column width can be re-sized on the screen by moving the mouse over the dashed vertical column separators in the column headers and expanding the column width to the right, or decreasing the width to the left. There is a scroll bar at the bottom of the report to be able to move across the width of all resultant columns on the screen.
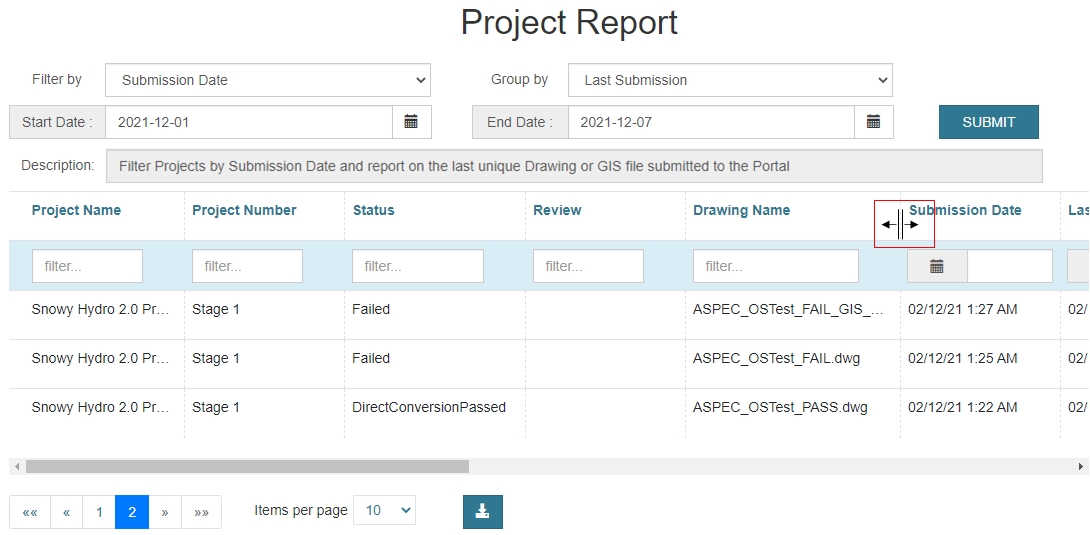
Fig: Expand column width.
Additional column filters can be applied using the Typeahead filtering functionality to filter records based on a given criteria. As the user inputs criteria to be filtered by, potential results appear in the filter text box as each character is entered.
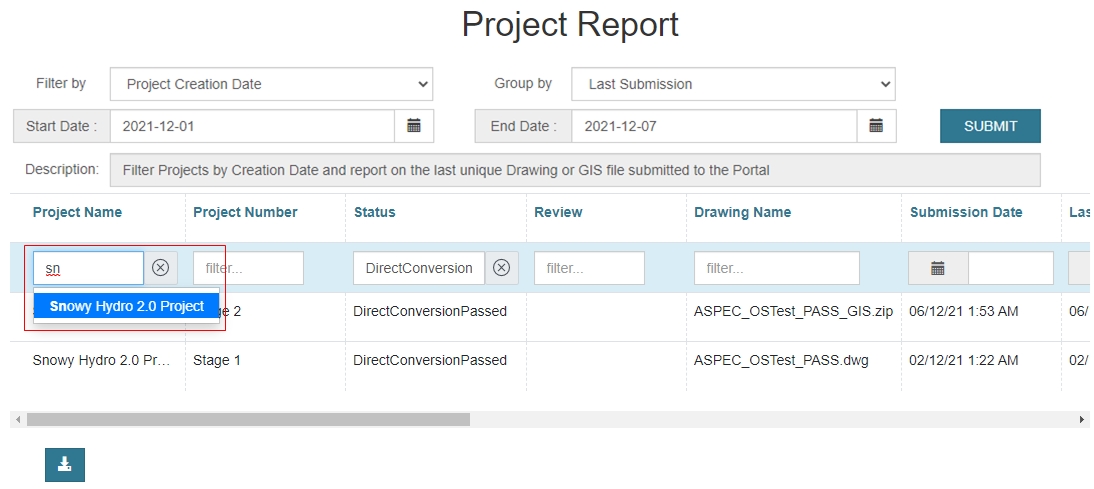
Fig: Project Report Column Filter.
The resultant report can be further refined by selecting the filter box below the column headers. The user can select any of the unique values from the filter list to apply to the report results.
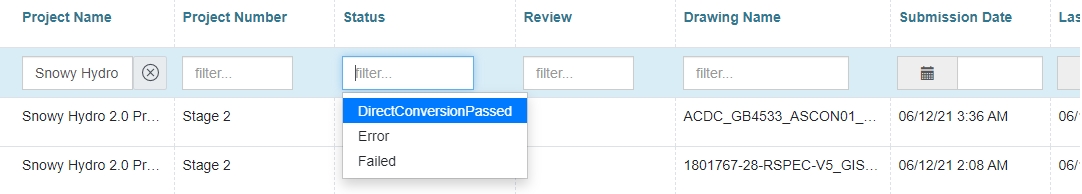
Fig: Project Report Column Filter.
The report provides the following information:
- Project Name - Displays the Project Name against which validation submissions were made.
- Status - Displays the Submission status.
- Review - Displays the Review status.
- Drawing Name - Displays the submitted Drawing Name.
- Submission Date - The date the drawing was submitted.
- Last Action Date - The date the last action was taken on the submission.
- Project Number - The Project Number assigned when the Project was created.
- Project Lead - The Name of the Project Lead assigned when the Project was created.
- Project Creation Date - The Date when the Project was created.
- Project Due Date - The Due Date assigned when the Project was created.
- Validation Set - The Name of the validation set used against files submitted.
- Developer - The Developer's Name.
- Branch - The Branch Name for the Developer who completed the validation submission.
- Submission User - The name of the user who completed the validation submission.
- Customer Name - The Customer's Name.
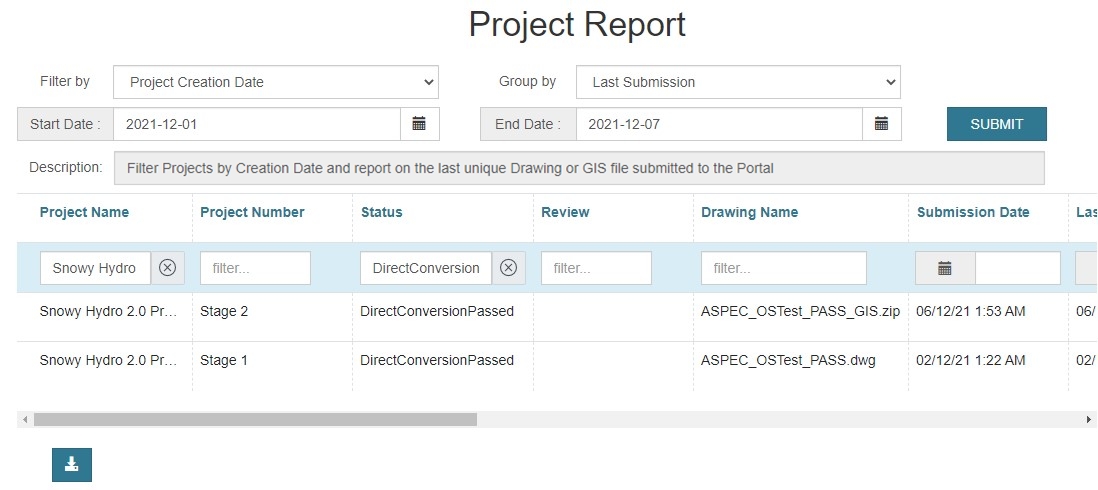
Fig: Project Report .
Customer Activity Report
The Customer Activity Report displays a list of activity that has transpired on the Customer’s ACDC Portal by the Customer’s Users for the past 30 days. The list can be further refined by selecting specific start and end date ranges using the date picker.
The report provides the Full Name of the Customer User, their email address, the Activity date and time, the Activity Type and a Summary which briefly describes the activity logged.
The most frequent Activity types include the following:
- DrawingSubmission - The Summary column details the drawing name submitted.
- ManageDocument - The Summary column details the name of the documents uploaded or downloaded.
- ManageOffice - The Summary column details the names of the offices added or deleted.
- ManageOrganisation - The Summary column details information pertaining to documents sets added or deleted, privileges added or removed, user groups added or deleted etc.
- ManageProject - The Summary column details information pertaining to projects added, updated or deleted, privileges added or removed for developer offices, etc.
- ManageUser - The Summary column details information pertaining to project documents added or deleted, content types assigned, etc.
- ResetPassword - The Summary column details which user’s passwords were reset.
- SignIn - The Summary column details when each registered user logged onto the Customer’s ACDC Portal.
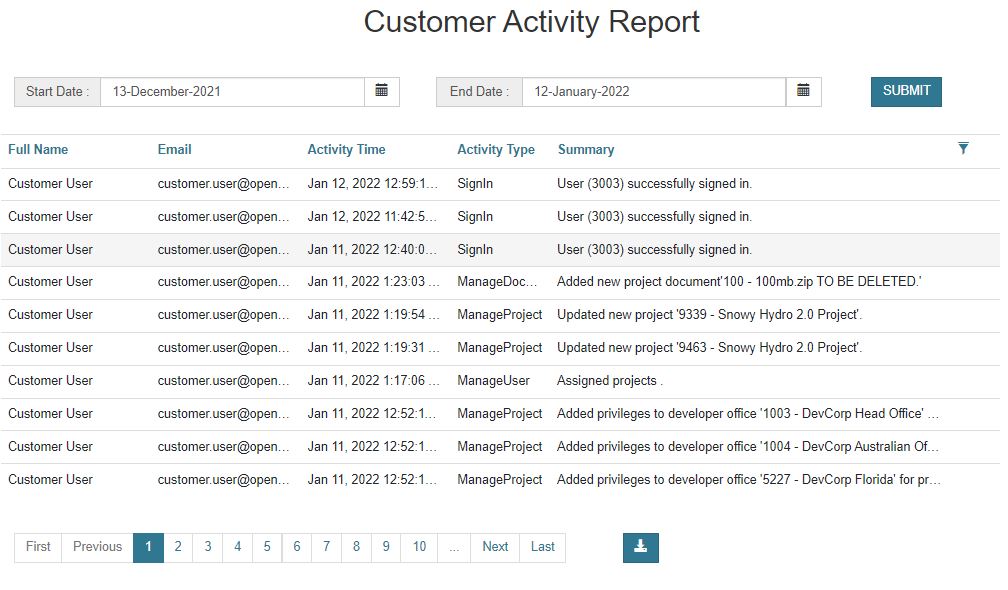
Fig: Customer Activity Report.
Customer Submissions Report
The Customer Submissions Report displays a list of Submissions that have been uploaded for Validation on the Customer’s ACDC Portal by their own users for the past 30 days. The list can be further refined by selecting specific start and end date ranges using the date picker.
The report provides the following information:
- Customer - Displays the Customer Name.
- Review Status - Displays the review status as an icon as per the descriptions below:
- Review Status not set.
 Review Status of Ready for Review.
 Review Status of Accepted.
 Review Status of Rejected.
- User Name - Displays the name of the user who uploaded the submission for validation.
- Name - Displays the file name added to the validation submission.
- Status - The current status of the Submission depicted by the status icon as per the descriptions below:
- Submission Status not set.
- Submission Status of Passed.
- Submission Status of Error.
- Submission Status of Failed.
- Submission Status of Canceled.
- Id - The unique Submission ID number recorded for each submission in the database.
- Description - Displays the name assigned to the Validation Description when submitted.
- Num. - The Submission Number assigned when the validation was submitted.
- Rev. - The Submission Revision Number assigned when the validation was submitted.
- Project - The name of the Project selected when the validation was submitted.
- Submission Date - The date and time of the validation submission.
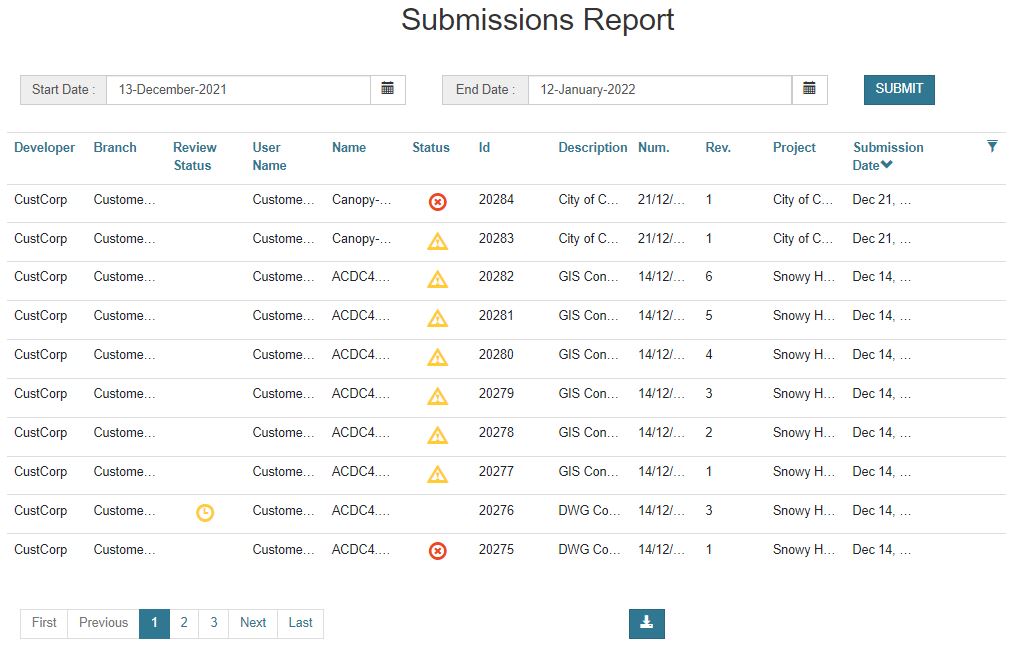
Fig: Customer Submissions Report.
Projects
There is currently only one Project report available to the Customer Administrator under the Reports section, which displays the number of Active/Inactive Projects.
No of Active/Inactive Projects
The No of Active/Inactive Projects report displays a pie chart and list of all Active / Inactive projects associated to the Customer that is logged in. Ensure that the Inactive check box is ticked (unchecked by default) to see both Active and Inactive Projects.
The order of the Projects is determined by the Project Due Date, where the latest due date is displayed first.
The report provides the following information:
- Project Name - Displays the Project Name as captured when the Project was created.
- Status - The current status of the Project depicted by the status icon as per the descriptions below:
- Project Status of “Active”.
- Project Status of “Inactive”.
- Project Name - Displays the Project Number as captured when the Project was created.
- Due Date - Displays the Due Date as captured when the Project was created.
- Validation Set - Displays the name of the Validation Set against which all submissions are validated.
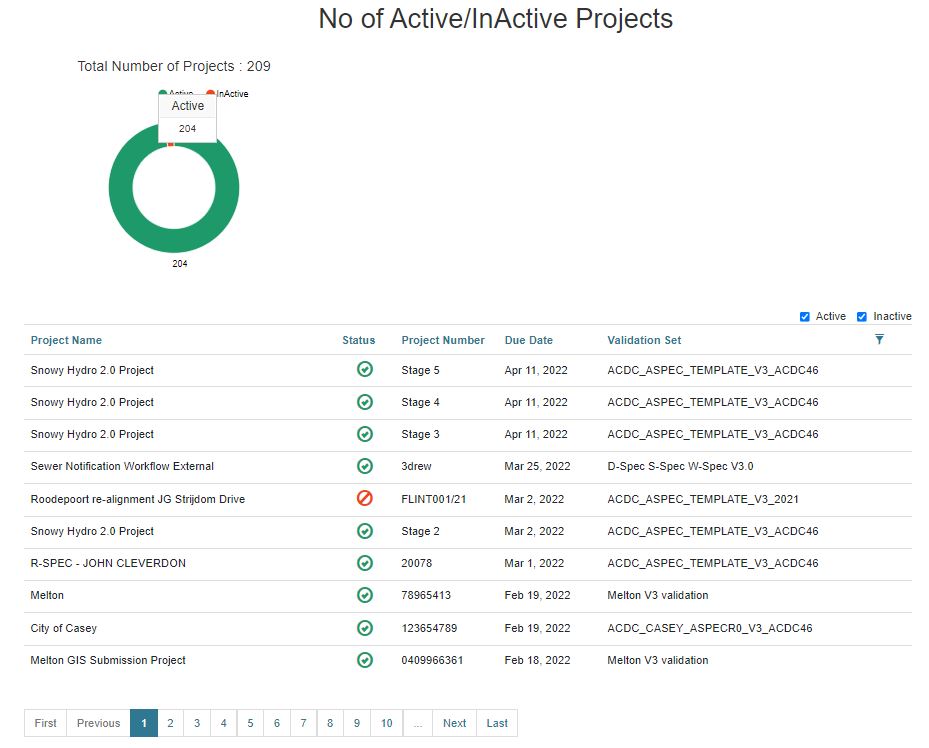
Fig: Number of Active/Inactive Projects report.